04.01.2019 - Comments

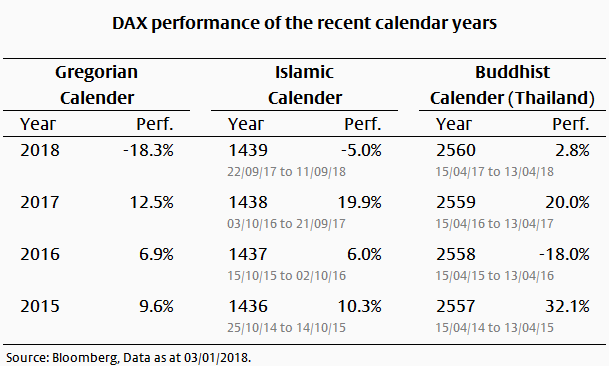
2018 was a particularly bad year for the German stock index DAX. The DAX lost a total of 18.3 % compared to the previous year. But what is the economic meaning of this annual performance?
In order to answer this question, we first have to realize that we are only comparing two index levels of two days, each of which we refer to as December 31st of the Gregorian calendar. The convention, however, to look at these two days is arbitrary.
What would the DAX performance look like if a different calendar had prevailed, for example the Islamic or the Buddhist one? The following table provides an overview.
The DAX in the Islamic calendar
The year 1439 of the Islamic calendar began on the 22nd of September 2017 and ended on the 11th of September 2018. The DAX lost 5.0 % during this period. In the previous Islamic year, the DAX achieved an impressive performance of +19.9 %. In both Islamic years, the DAX performed significantly better than on the basis of the Gregorian calendar.
The DAX in the Buddhist calendar
The year 2560 of the Thai Buddhist calendar began on April 15th, 2017 and ended on April 13th, 2018. April 14th is the day of transition, which does neither belong to the previous year nor to the next. The DAX performance in the Buddhist year 2560 was +2.8 % and, in contrast to the performance in the Islamic and Gregorian calendar year, is even positive.
Particularly striking is the Buddhist year 2558 (April 2015 to April 2016, Gregorian calendar). The DAX performance amounted to -18.0% and thus fell just as badly as the most recent Gregorian year 2018. Neither the annual performance according to the Gregorian nor the Islamic calendar indicates that there has been a significant loss in the meantime during this period. If the Buddhist year end were to be postponed only five days, the annual loss would be 22.2 %.This loss is even worse than in the most recent Gregorian calendar year.
Volatility blurs the view
If you look at only two points in time of a volatile price, you can come to very different conclusions depending on the choice of points in time. This can happen if the points in time differ by only a few weeks. Sometimes a year looks very bad and at other times a double-digit price loss is not even visible.
Care should therefore be taken when drawing conclusions too quickly from an annual performance figure. In the case of the DAX, it is helpful to look at additional indicators such as long-term performance, the range of variation or the share price performance within the year.


